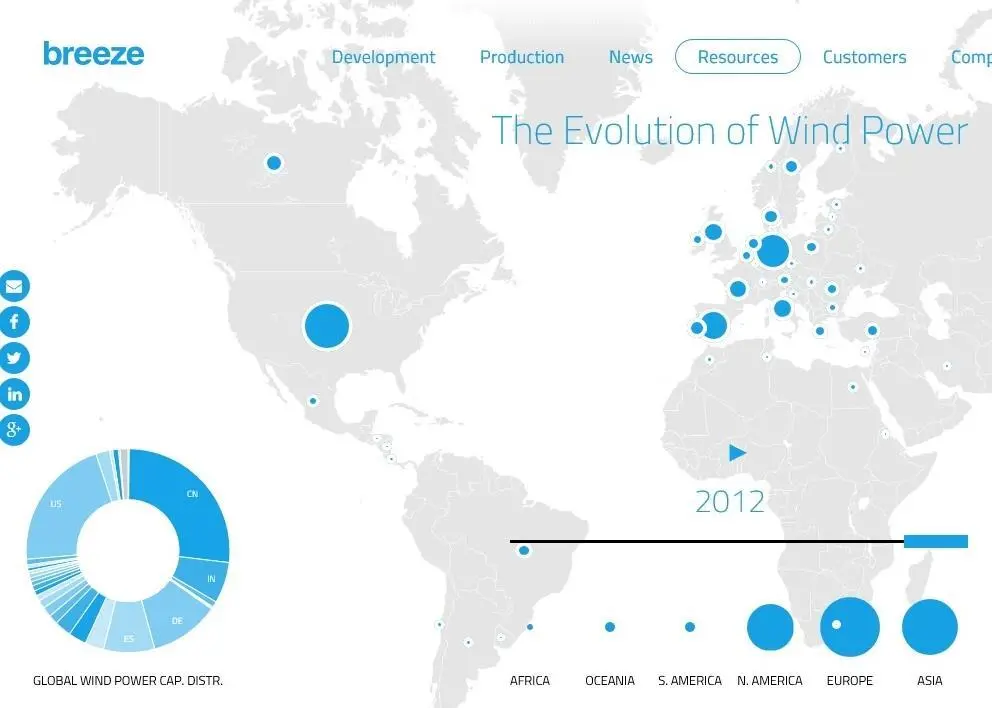
It might come as a surprise how dominant Denmark and the US were back in the 1980s and how small the wind power industry was. ‘The Evolution of Wind Power’ map also illustrates how wind power capacity has evolved between continents, clearly showing the tremendous growth in Asia in recent years at a pace that few expected.
Breeze co-founder and Head of Marketing Fredrik Larsson said: “What we do at Breeze is visualizing data in ways that makes it more accessible, more useful and easier to understand. ‘The Evolution of Wind Power’ is an example of how existing data sets can be presented in a new way which can lead to insights. Building over 300 GW of global wind power capacity in 30 years is an amazing accomplishment for our industry and we are certain there is much more to come.”
Breeze is a software platform for modernising wind resource assessment and wind farm management for professional wind power developers, consultants, owners and operators. At Maritime Journal’s suggestion Breeze are considering offering a breakdown of onshore versus offshore generation and a power output per capita for each country and continent for future versions.
See the infographic at http://www.breezesystem.com/resources/wind-power-capacity-map/
By Jake Frith