![MaritimeJournal[Seawork]](https://www.maritimejournal.com/wp-content/uploads/2026/09/MaritimeJournalSeawork.svg)





Continuing growth for European offshore wind
Recently released statistics illustrate the steady growth of the European offshore wind industry, while also pointing out that EU Member States are lagging behind their offshore wind energy targets.
Statistics can be heavy going with care needed in their interpretation. However, European offshore wind industry – key trends and statistics 2012 from the European Wind Energy Association presents the data in an easily understandable and eloquent form providing a positive one year snapshot of the industry.
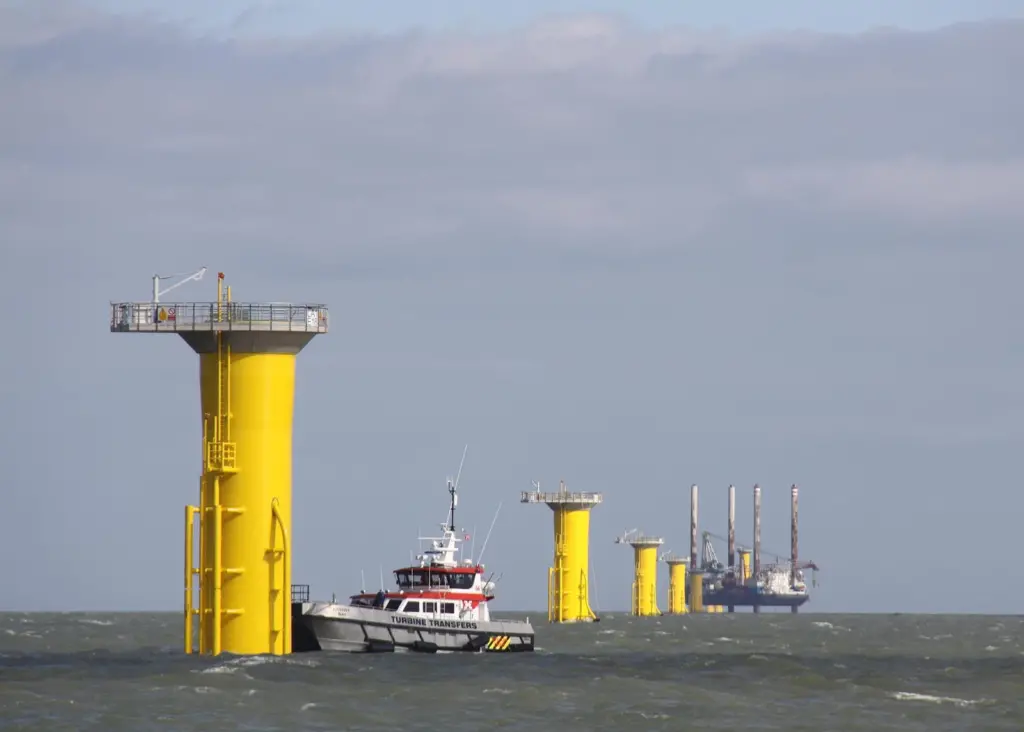
During 2012, 369 turbines were erected, an average of 3.9MW per day. Of these, 293 at nine windfarms were fully grid connected totalling 1,166MW, 33% more than in 2011 and representing investments of around €3.4 billion to €4.6 billion. Four windfarms were completed: Ormonde, Walney 2, Greater Gabbard and Sheringham Shoal. Five were partially completed: Thornton Bank (phase 2 and 3), Lincs, London Array, Arnholt and Bard Offshore 1 with foundation installed at another nine in Europe.
A breakdown of the 1,166MW total figure shows over 73% (854.2MW) were in the UK, Belgium was second with 16% (184.5MW), Germany third at 7% (80MW) and Denmark with 4% (46.8MW). It has to be remembered this is for just one year, 2012. The offshore turbine market comprised just three manufacturers: Siemens with 860.4MW (74%), REpower with 225.1MW (19%) and BARD with 80MW (7%).
Ten power producers accounted for 75% of connected capacity (in 2011 just five producers developed over 90% of installations) with DONG topping the list at 19%. The 25% ‘other’ producers comprised eleven companies.
The report looks at statistics and trends of the technology itself starting with foundations. Monopiles remain most popular with 355 (73%) installed during 2012, followed by 61 jackets (13%), 29 tripods (6%), 24 tripiles (5%) and 16 gravity (3%). A breakdown of foundation manufactures lists ten companies, Bladt well out in front at 193 (40%) foundations installed.
Average size of turbines grid connected in 2012 was 4MW, 11% bigger than 2011 in a market still dominated by Siemens 3.6MW model. There was a marked increase (43%) in average size of the 18 windfarms under construction in 2012, now standing at 285.6MW confirming the trend towards larger turbines and bigger projects. There was little change in the average water depth in 2012 from 2011 but average distance from shore saw a 24% increase at 29km.
CUMULATIVE STATISTICS & TARGETS
Cumulative figures paint an interesting ‘big picture’ of the state of the industry across Europe with 1,662 turbines now connected at 55 offshore windfarms in ten countries, delivering a total capacity of 4,995MW. Breaking these figures down, 58.9% are in UK waters, 18.4% in Denmark, 8% in Belgium, 6% in Germany and 5% in The Netherlands. Looking further afield, of 5,538MW global installed capacity, 90% is in Europe, 9% in China and 1% in Japan.
Despite the steady growth, it is pointed out that deployment is lagging behind EU Member States’ objectives and to a lesser extent EWEA’s expectations. Each State’s position at the end of 2012 is detailed with collectively, a 14.3% shortfall between National Renewable Energy Action Plan targets and the real installation figure.
A positive note is reported with financing activity growing faster than the sector itself on both debt and equity sides during 2012. Despite the Eurozone crisis and banking market problems, offshore wind continues to be viewed a core sector of activity for project finance banks and multilaterals. Participation of PensionDanmark as a lender is highlighted, the first time an entity other than a bank provided a loan to the industry.
Other areas of this revealing report cover market outlook 2013/2014, trends, national and industry announcement and offshore grid developments.
Related Articles
 OTHER NEWS
 FEATURES & VIDEOS
 MARINE CIVILS