![MaritimeJournal[Seawork]](https://www.maritimejournal.com/wp-content/uploads/2026/09/MaritimeJournalSeawork.svg)




Hydrographic survey: technology advances the charts
Thirty years ago signified an era of tapes and magnetic disks with manufacturers plying their latest solid state microprocessor-controlled wonders to expectant users seeking data loggers generating 100 soundings per second supported by 16 and 32-bit desktop computers with 20MB memories.
Further afield, line-of-sight radio positioning provided by the likes of Decca, Motorola and Sercel remained a mainstay for any number of offshore and inshore applications whilst in Monaco, the International Hydrographic Organization (IHO) had just established standardisation of symbols appearing on new charts in the hope that they would be readily understood by any shipmaster negotiating South Korean waters or wherever.
In the US, GPS, then known as Navstar, was still in its infancy with just seven orbiting satellites and the promise of a complete constellation of eighteen or more by 1991. Operated and maintained by the US Air Force, it has since become the staple satellite survey positioning facility and has subsequently been joined by a comparable soon-to-be completed Russian Glonass network while others are planned by China, India and Japan. Europe in the meantime anticipates its own Galileo mass-market facility due to become fully operational in 2019; costing an estimated €5 billion and comprising a total of 30 satellites, it will provide accuracies of 1 metre or 1 centimetre in encrypted form.
The 1980s also saw progressive development of sensors, including high-frequency multibeam sonar systems based on earlier commercial concepts first introduced in 1977. Meanwhile, the world’s conference halls were consumed by the prospects of electronic charts and their associated electronic chart display and information systems (ECDIS). At times there appeared to be more debates about electronic charts than there were ships to sail with them.
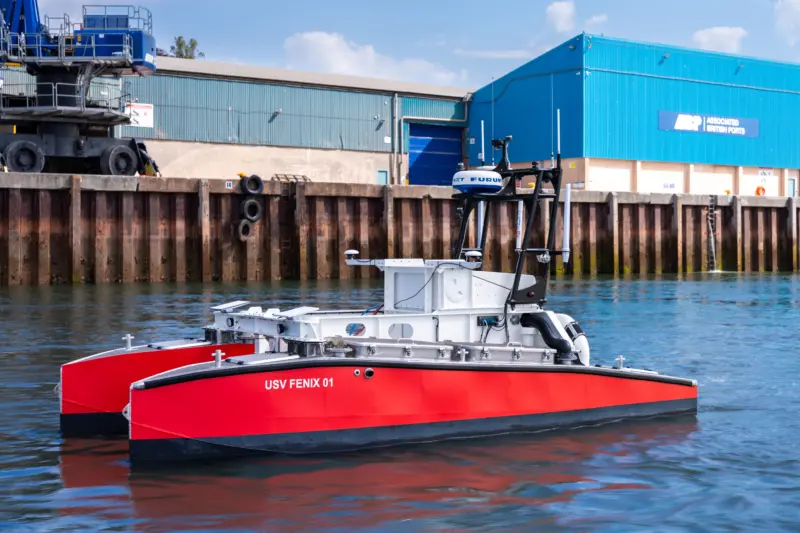
But the age of electronic nautical charting is now a reality thanks mainly to available computer processing power doubling every 18 months or so (Moore’s Law). This has led to the age of so-called Big Data with modern equipment capable of generating over 100GB of data per hour for mapping, motion sensing and delineation as well as positioning above and below waters. And it has also led to development of robotics together with full-scale use of autonomous or fully automated unmanned surface and sub-surface vehicles by way of complementing traditional vessel-borne survey and research operations.
All these advances and more will be needed to map the world’s entire ocean floors by 2030 under Seabed 2030, an ambitious collaborative project launched at the recent UN Ocean Conference in New York. A joint venture between the Nippon Foundation of Japan and the General Bathymetric Chart of the Oceans (GEBCO) operating under the auspices of the IHO and the Intergovernmental Oceanographic Commission (IOC) of UNESCO, it involves leading organisations in Germany, New Zealand, Sweden, UK and the US. To date less than 15% of all seas are mapped with in-situ soundings, so there’s a sizeable task ahead.
By David Goodfellow